This article was first published in the Journal of Performance Measurement Volume 25-3
Proprietary Models which implement Equity Attribution Reporting almost universally follow the Brinson Additive Model where currencies are not actively managed – or the Karnosky-Singer Model where they are.
No ‘Generic Models’ exist for Fixed Interest Attribution; instead, academics working alone or with Software Suppliers have individually designed models.
This can be very challenging for individuals looking to gain an understanding of FIA as every implemented model appears to present a re-learning exercise. However, this is not the case – considerable commonality exists across models.
Defining a ‘Generic FIA Model’ could help to address this problem. The natural complexity of FIA means that establishing a definition would be a significant challenge; in fact, many believe it can’t be done.
This article, however, makes a start on that road in a first known attempt to categorise and compare across implemented FIA models using a common data set. The framework introduced here allows further models and instruments to be added.
This article will:
- Define three distinct categories for FIA models – Top-Down, Bottom-Up or Hybrid
- Document where overlap exists across selected models
- Highlight the issues in developing a Generic Model incorporating the key returns of well-known proprietary models.
Performance Measurement for Investment Funds first entered mainstream client reporting about 30 years ago, following the publication of Peter Dietz's eponymous methodology in the 1980s.
It was followed by Equity and then Fixed Interest Attribution Reporting, although these are mostly confined to internal reporting and are unaddressed by GIPS. New entrants to the ‘Middle Office’ often find these complex applications a challenge to get to grips with, particularly FIA.
Gary Brinson/Nimrod Fachler and Denis Karnosky/Brian Singer published their attribution methodologies 36 and 27 years ago respectively. These rapidly became the standard for Benchmark-Relative Equity Attribution; proprietary attribution software had to demonstrate compliance with both methodologies.
However, pressure for a fixed income-specific methodology came from the different risk/return characteristics of bond funds with a management focus more related to Yield Curve positioning.
Accordingly, papers from Timothy Lord, Gerard Van Breukelen, Stephen Campisi (Lord, 1997, van Breukelen, 2000, Campisi, 1997) and others started offering answers. Giguère (2005) first summarised GRAP thinking with the alternative ‘Bottom-Up’ and ‘Top-Down’ FIA approaches.
The key characteristics of many of these papers have now become part of market-available software solutions. While Equity Attribution software solutions look to Brinson/Karnosky Singer compliance, FIA is more complex and proposed solutions more recent. As a result, to date, each FIA paper – often as further embellished by the software developers – has tended to set its own standard.
Now, after the twentieth anniversary since the original papers were published, we can start to investigate whether there is scope to draw submitted papers/implemented FIA models together to consider the possibility of a Generic model.
HISTORY
Several early papers focused on a ‘Yield Curve Decomposition’ approach to FIA which used polynomial mathematics to isolate the ‘shift’, ‘twist’ and ‘butterfly’ curve changes between period start and end dates.
The models featured in this article use the alternative 'Duration' approach of that time.
This calculates these Term Structure returns as just -ve Modified Duration*yield movement and more simply categorises them into ‘Parallel’ (ie Shift) and ‘Non-Parallel’ (ie ‘Other’ or ‘Everything Else’). KRD and full re-pricing methods have also developed alongside these.
TERMINOLOGY
As alternative names exist for some of the terms used in this article, here is a short dictionary:
|
Used Here |
Also Known As |
|
Income Return |
Carry Return |
|
Government Curve |
Treasury, Sovereign or Risk-Free Curve |
|
Corporate Curve |
Credit, Spread or Non-Government Curve |
|
Non-Parallel |
Twist, Reshaping |
APPROACH - CONSIDERING A GENERIC MODEL
Exercise
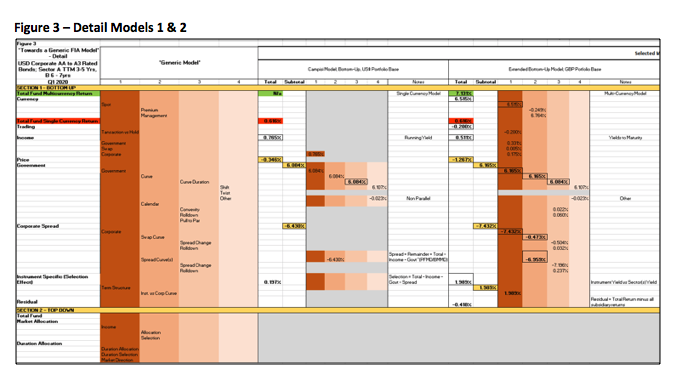
Four implemented FIA models have been compared side by side, allowing returns of each to be copied from ‘right to left’ i.e. into a potential all-encompassing ‘Generic’.
Parts of some models naturally overlap, thus instead of four Generic returns, we have three or fewer. In other cases, all four are unique and all retained in the Generic.
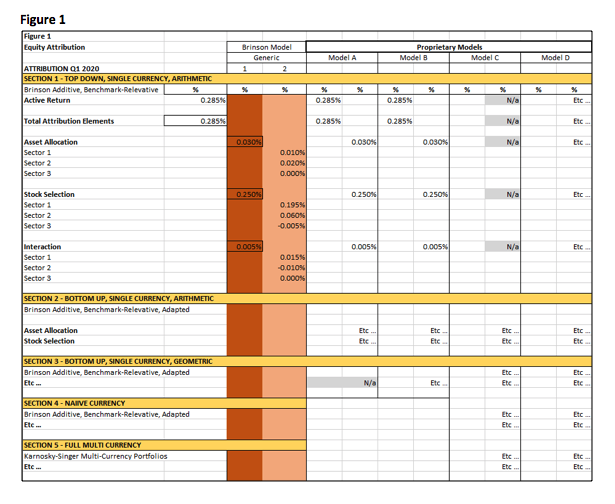
An equivalent EA exercise might appear as in hypothetical Figure 1 below. Here, the copying process would be the opposite of FIA i.e. from ‘left to right’ as the implemented models comply with the Generic. Hence the indicative models are shown in Figure 1 comply with the ‘Generic’, taking into account the different options (e.g. arithmetic, geometric).
In Figure 1, Model C has only a geometric offering, so shows N/a in the arithmetic section – A is arithmetic only. A and B offer base currency returns only. But within the Generic definitions, all four comply.
Scope
Included at this stage
Instruments: the exercise uses actual historic data and actual instruments for the chosen period of Q1 2020. The Foreign Corporate Bonds have been given example Portfolio and Benchmark Weightings. Choice of this instrument type results in the following options for returns by sector:
(a) Instruments
(b) Corporate Curve
(c) Swap Curve
(d) Government Curve
(e) Currency (for Sterling portfolios).
The selected U.S. Corporate Bonds ('Foreign' to a Sterling base portfolio) were chosen at random while meeting two criteria:
(a) having an S&P Credit Rating between AA1 and A3
(b) having a remaining Time to Maturity of between either 3 – 5 or 6 – 7 years; thus two sectors were created as required by the Benchmark-Relative Hybrid approach.
FIA reporting of Bottom-Up models can be via excess (active) return, as above, alternatively the Portfolio and Benchmark returns can be separately calculated and optionally later compared side by side. For simplicity here for Bottom-Up, the two sectors have been combined to give a single return and a Portfolio return only.
Reporting Period: although FIA is usually reported daily, a full Quarter, Q1 2020, has been chosen for this exercise. This was in order to highlight how FIA reports a recognisable ‘Flight to Quality’ event, which occurred in that period.
Selection of Implemented Models: no particular methodology has been used to select the chosen models. The re-publication of the Campisi Model as a ‘Landmark Article’ in the Summer, 2020, edition of this Journal together with its return calculations prompted its inclusion as the first model.
Three other models were chosen for: their known wide acceptance, the fact that return information relating to their calculations exists in the public domain, and to cover both Bottom-Up and Top-Down/Hybrid approaches.
From this, it was possible to confirm the emergence of three separate model categories:
- ‘Bottom-Up’
- ‘Top-Down’
- ‘Hybrid’ (ie characteristics relevant to both 1+2).
‘Indicative Returns’ and ‘Indicative Data’: both are treated as ‘indicative’ here because:
- the returns have been calculated from published information rather than by the authors
- the data is historic so some now partial only and accuracy cannot be certified in every instance.
The resulting returns are acceptable for this exercise, however, as they show:
- the return categories available from each model
- the calculated returns reasonably match the expected FIA output for the chosen period given that Quarter’s known yield movements.
Actual model names have only been shown where the authors have given specific permission to do so; otherwise anonymous names have been used.
Excluded at this stage
Instruments: Asset-backed and Inflation-protected securities.
Returns Calculations: examples of KRD and/or full repricing-based models are not included. It is not thought that these would introduce significantly different return outcomes for the purpose of this exercise.
Fund Management: the exercise is designed to show just the returns available, not how these might be used in combination with other data to manage funds in practice. Although a manager might, for example, introduce hedging or arbitrage via futures, how this would be managed and reported is outside the scope of this article.
Promotion: the article does not aim to promote any individual model over any other.
QUARTER 1, 2020
Market
This period demonstrated a classic ‘flight to quality’.
The potential impact of the Coronavirus on corporate earnings initially resulted in a temporary 30% decline in the Dow Jones in Q1. This drop was followed by a sharp rise in Corporate Bond Yields. For example, Corporate BB yield rose to nearly 9% in late March - given concern over companies’ ability to service coupons.
By the first quarter-end, yields had largely fallen nearer to ‘normal’ levels although they remained above start.
For a short period market liquidity issues even forced Treasury Yields to rise, although, by quarter-end, they had fallen to be well below start as expected in such a situation.
FIA Returns
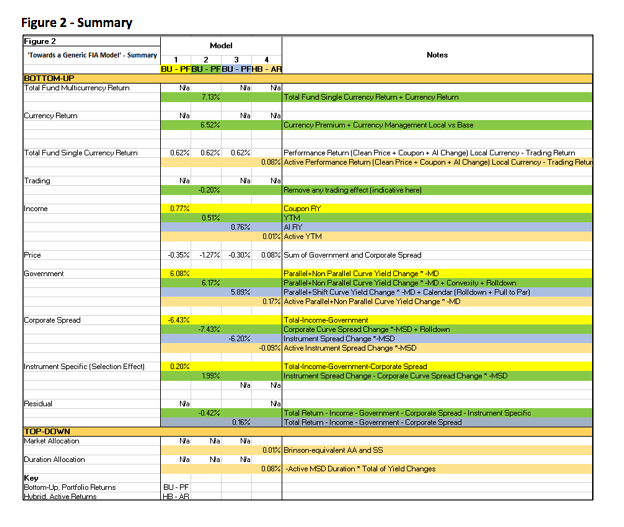
Bottom-Up: although the yield of the Corporate AA1-A3 Curve used in the exercise increased by only about 0.5% over the period, FIA correctly reports a 6 - 7% negative Corporate return, depending on the model, even though the portfolio’s MD is only about 4. This return is due to the widening of the Corporate Spread over the Government and Swap curves, both of which show positive returns.
This is classic FIA ‘Flight to Quality’ reporting.
There is positive Instrument-Specific reporting as our portfolio instruments showed a lower widening than their Corporate AA1-A3 Curve, reflecting a positive selection decision.
Hybrid Bottom-Up: in contrast to the Bottom-Up models, the Benchmark-Relative Hybrid approach reports the excess return, reflecting portfolio vs benchmark positioning re the Yield Curve. A generally longer Portfolio Duration than Benchmark has resulted in a positive Government return but negative Corporate return, although overall positive return vs the overall negative of the other models.
Hybrid Top-Down: this offers a useful alternative analysis of the Quarter 1 returns.
It shows that the small positive active Income return comprised positive sector allocation and instrument selection decisions.
It also shows that the overall positive Price return comprised mostly positive duration allocation decisions.
TOWARDS A GENERIC MODEL
The exercise results are shown in:
Figure 2 ‘Summary’
Figure 3 ‘Detail’ – First two models
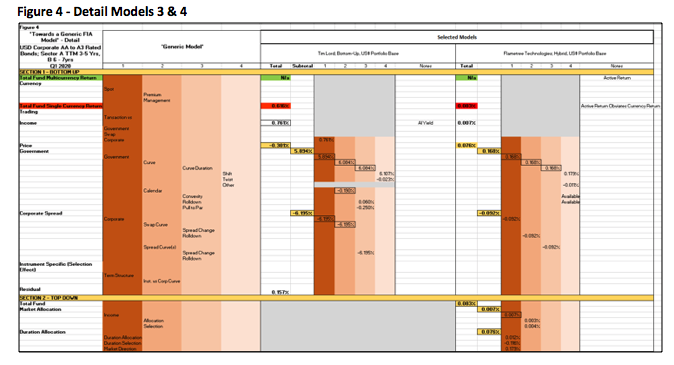
Figure 4 ‘Detail’ – Second two models.
This exercise has achieved both clarification and the highlighting of issues to be clarified when thinking towards the Generic.
- ‘Headline’ Returns
Clarified
All four models agree on the following ‘Headline’ returns:
- Income
- Government
- Corporate (last two combined into a ‘Price’ return).
Not Clarified
The following returns while valid appear in some models only:
- Trading
- Instrument-Specific (Bottom-Up)
- Currency
- Model Residual.
Notes
- Income: although all models have this Headline the analytic can be either Running yield or Yield to Maturity with very different results in the current market. Technically, the use of RY should result in the reporting of a Pull to Par return but only one model does this
- Trading: as all FIA returns assume static portfolio opening positions the total performance return to which they are reconciled has to be adjusted, if transaction-based, to a ‘Buy and Hold’ equivalent return; only one model does this
- Instrument-Specific (Bottom-Up): a corporate bond’s return is part instrument and part that instrument’s sector, the difference being a Selection effect. Only two of the models isolate this effect and do so in different ways
- Currency: the currency return reconciles total local currency return to a total base currency performance return. Only one model isolates this effect
- Model Residual: there will almost always be a residual, even if small, as we are reconciling a clean price+income+AI performance return to separately-calculated underlying returns. Only two models isolate this, however; for the others, any residual rather than being explicit is combined with other returns.
Any return not individually isolated will become part of another return or be included in the model residual.
Decomposition of ‘Headline’ Returns Clarified
All four models agree on the following decompositions:
- Government: breakdown into Parallel (Shift) and Non-Parallel (Other) returns.
Not Clarified
- Income: it is possible to analyse the income across sources eg Government, Corporate, Swap but only one model isolates these
- Government and Corporate: for both, two models offer the additional, smaller, returns of Convexity and Rolldown, the others don’t. Note these are additional returns, not a breakdown. Where not isolated, their returns are incorporated into other returns or the Model Residual.
CONCLUSION
This article set out to investigate whether a Generic FIA model could be defined.
Whilst GIPS has set standards for Performance Reporting and Brinson has forced something similar for Equity Attribution, we remain some way off anything Generic with FIA. The following has been achieved, however; we have demonstrated, based on the instrument type and the models selected, that:
Categories:
- existing FIA models can be categorised into one of three approaches - Bottom-Up, Top-Down or Hybrid
- the following ‘Headline’ returns - Income, Government, Corporate, Price - are common across all approaches
- we are in a better position than indicated in the opening statement
- under INTRODUCTION above ‘… every model … has tended to set its own standard’. There is, in fact, considerable commonality across models as outlined in TOWARDS A GENERIC MODEL above
- whilst several differences between models also exist – the existence of certain returns at all and in the breakdown of the ‘Headline’ returns - we have defined which those are, where they exist and why
- we have introduced a framework against which further models could be aligned in a future article
- through Categorisation we have made the familiarisation process easier for those needing to gain an understanding of FIA.
Separately, we have provided a real life example of how a market ‘Flight to Quality’ would be reported by FIA.
To learn more about Fixed Income Attribution from world-leading practitioners, register for our Fixed Income Attribution course.
References
‘The Attribution of Portfolio and Index Returns in Fixed Income’, Timothy J. Lord, JPM Vol. 1-2, Fall 1997
‘Fixed-Income Attribution’ Gerard Van Breukelen, JPM Vol. 4-4, Summer 2000
‘Primer on Fixed Income Performance Attribution’, Stephen Campisi CFA, JPM Vol. 4-4, Summer 2000, reprinted Vol. 24-4, Summer 2020
‘Fixed-Income Attribution: Proposal of a new methodology’, Philippe Gillet and Bernard Hommolie
‘A generalised hybrid fixed income attribution model’, Andrew Colin Phd, FIMA CMath and Katlin Kiss, Flametree
Also many thanks to Ian Thompson, Grégoire Hug and Tim Escott for their peer reviews and general assistance.