The correlation between the returns on stocks and default-free government bonds determines a crucial part of the scope for portfolio diversification – but its significance goes well beyond that. The correlation is a vital summary statistic of the macro regime, and arguably, its relevance to asset allocation is as high in the current scenario as ever.
This article will delve into the stock-bond correlation, beginning with a review of the empirical research on diversification and rounding off with a discussion of the main macro risks in the current scenario. What are the macro drivers of this vital cross-asset relationship, and how does monetary policy fit into the picture? How can we explain the generally negative correlation over the past 20 years, and could this be about to change?
The observation that portfolio diversification often fails when it is most needed is not new. Ang and Chen, (2002) documented that equity returns are more correlated during bear markets than during bull markets. Longin and Solnik (2001) found that international contagion from the US to developed markets such as the UK, France, Germany and Japan is more pronounced when the US market is in a downturn. Bae et al. (2003) documented contagion effects both between emerging markets and from developed to emerging markets.
Focusing on methodological issues, Chua, Kritzman, and Page (2009) argued that full sample estimates of correlations often belie expectations of diversification effects. For example, comparing the US Russell 3000 index with the MSCI World Ex-US index over the period from 1970 to 2008, they found that when both markets were up by more than one standard deviation, the correlation between them was -17%. But when both markets were down by more than one standard deviation, the correlation between them was +76%, rising to 93% in cases of extreme crisis when both markets were down by more than two standard deviations.
Diversification appeared to work precisely when it is not needed, in market upturns when unification is desirable, whereas it fails in downturns.
This asymmetry is a considerable challenge for standard approaches to portfolio optimisation: the authors demonstrated that using conditional correlations, focusing on months when returns are above or below a given threshold, can add vital information to the correlation structure.
Using this is in what they called full-scale optimisation – incorporating features of the empirical distribution – they offer a methodology that can minimise the correlation asymmetry in portfolios. In a more recent study, Page and Panariello (2018) updated these findings and expanded the scope of the analysis to include more asset classes.
Stocks Versus Bonds
Stocks and default-free government bonds have been an exception to the general breakdown of diversification. During the past 20 years, bonds have exhibited negative average correlations with stocks as opposed to the positive correlations that had dominated previously.
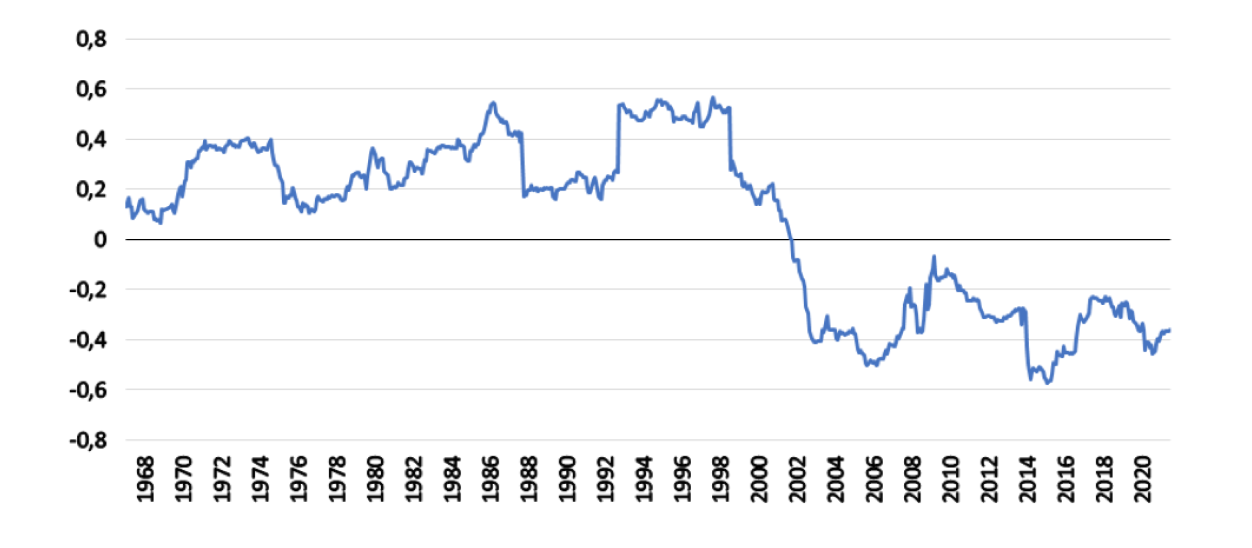
This is illustrated in Figure 1 which shows rolling 5-year rolling correlations between the total return on the S&P500 and the 10-year US Treasury note. From a general perspective, the shift in the correlation regime during the past 20 years has been favourable.
Figure 1: 5y Rolling Correlations: Monthly returns, S&P 500 / 10y UST
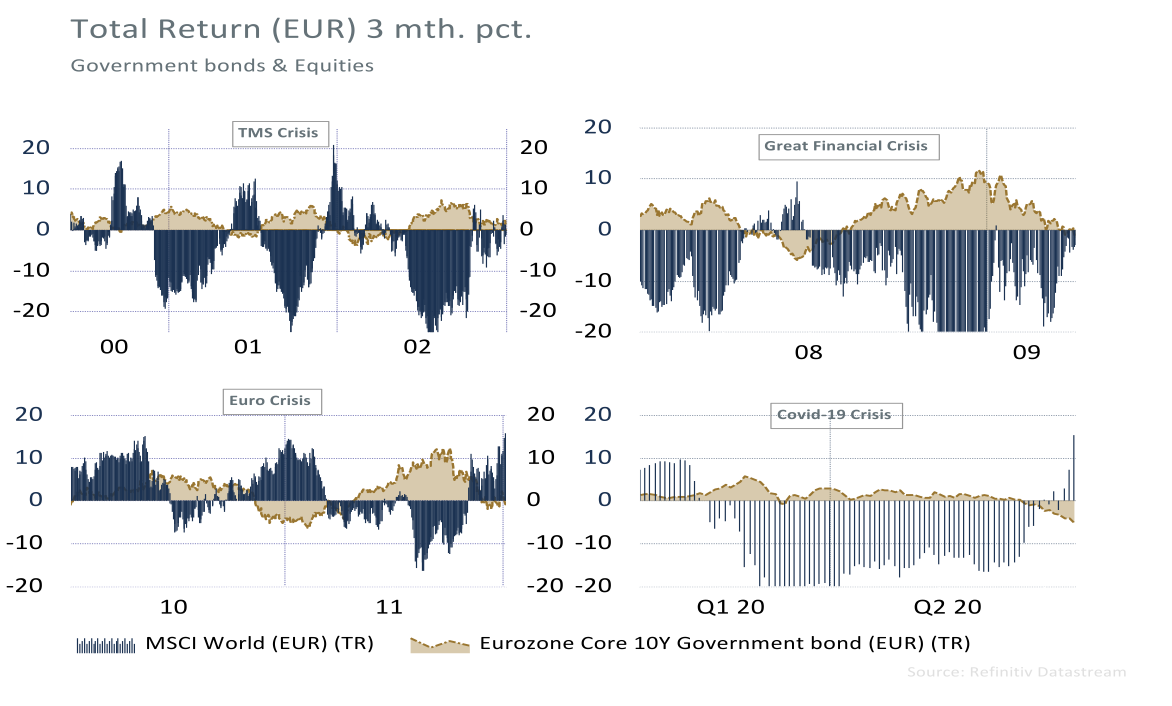
But is this about to change? Market reactions during the early part of the Covid-19 outbreak might have offered a foretaste of things to come. This is illustrated in a European perspective in Figure 2, comparing the short-term performance of 10-year Eurozone core government bonds with that of the MSCI World index – both denominated in euros.
When Covid-19 set in, government bonds did indeed move inversely with the collapsing stock market. However, the bond rally was considerably more muted than during the bursting of the internet bubble, the Great Financial Crisis and Europe’s Sovereign Debt crisis. So does this mean that long-dated government bonds lost most of their capacity to function as a hedge asset for stocks? To address this, we will turn to the fundamental drivers of the stock-bond correlation.
Figure 2: The limits of bond diversification
Macro-drivers of the Stock-Bond Correlation
Ilmanen (2003) examined the correlation between S&P 500 performance and that of 20-year US Treasuries from 1926 to 2001. He put his observations for each asset class into context through the standard valuation models.
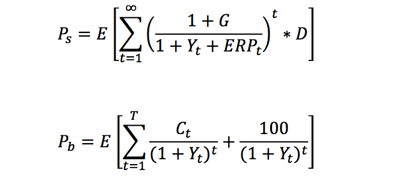
The price of each asset class expresses the discounted value of their future cash flows. In the case of stocks, in the first equation, the relevant cash flow is expected future dividends, D, and their expected growth rate, G.
In the case of bonds, in the second equation, the future cash flow is fixed, consisting of future coupon payments and the repayment of its par value at maturity. But for both asset classes, the discount rate applied is uncertain. For stocks, this is expressed in the well-known equity risk premium, ERP. For government bonds, the yield expresses expectations for future short-term rates and changes in the term premium.[1]
So how does this relate to macro-fundamentals, and what might the direction of causation between the two asset classes be? Ilmanen makes the following conjectures:
Changes in growth rates
The G of stock market valuations rises in an economic upswing, but higher economic growth will typically push bond yields higher.Flight to quality
Typically seen during output shocks such as recessions. The equity risk premium rises while the term premium on bonds is reduced.In both cases the correlation between the returns on the two asset classes becomes negative. Equally important, stocks are likely in the driving seat, prompting flows either into or out of bonds. Put differently, the direction of causality is arguably from stocks to bonds.
Changes in inflation
The case for bonds is straightforward. Higher inflation decreases the value of future cash flows and raises expected future short-term rates (expected monetary tightening). In principle, stocks could be unaffected since higher future cash flows could offset higher discount rates. In practice, higher inflation creates uncertainty over future earnings growth enhanced by expectations of monetary tightening. In cases of lower inflation, the opposite applies.
Changes in Monetary Policy
Monetary easing boosts the performance of both asset classes. Monetary tightening does the opposite.
In both cases, the correlation between the two asset classes becomes positive. But bonds are now in the driving seat, prompting flows into and out of stocks. The direction of causation is likely to be from bonds to stocks under these scenarios.
Figure 3 gives a summary of these ideas:
Figure 3: Som cet. par generalisations
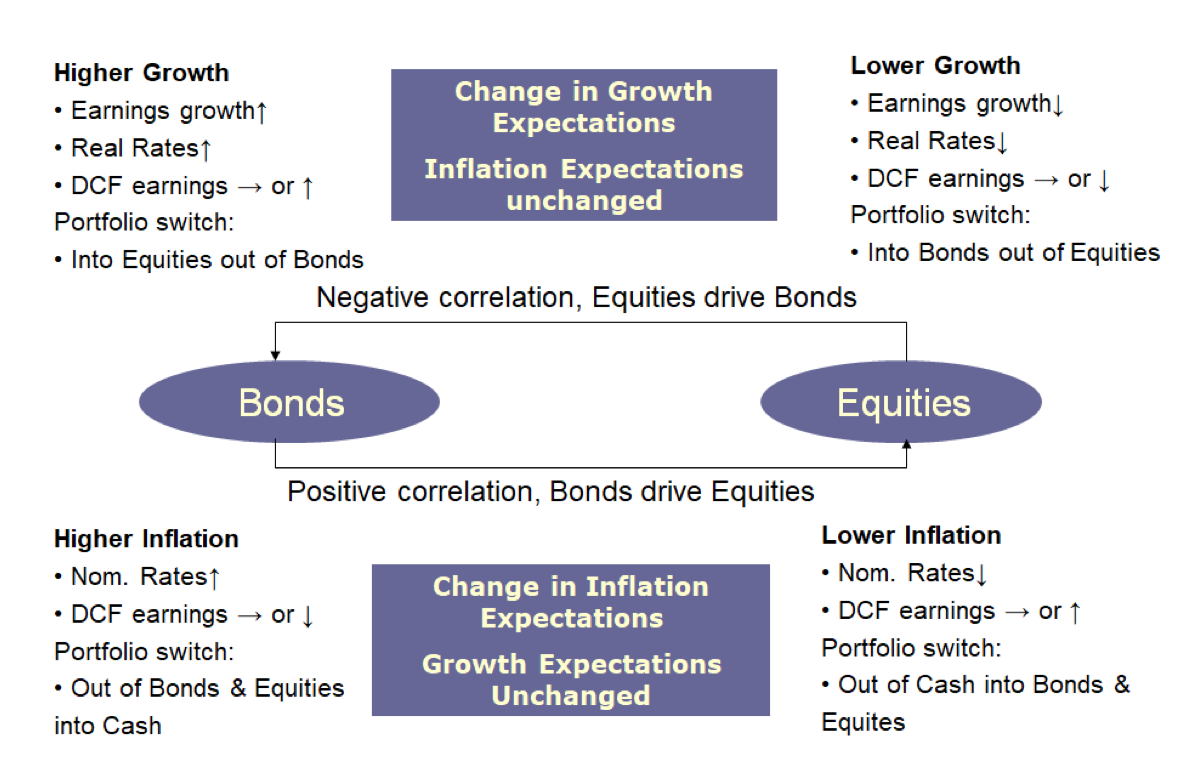
Ilmanen’s empirical research supports these general conjectures. His findings over the period analysed can be summarised as follows:
Periods of particularly high growth and periods of contraction have typically seen the two asset classes decouple with a negative correlation.
Periods of exceptionally high inflation have generally coincided with a high positive correlation, whereas declines in inflation have tended to reduce the correlation, and deflation has made it negative – Japan being the out-of-sample case in point. Changes in monetary policy have usually made for a positive correlation, with periods of easing boosting both stocks and bonds, and stocks typically outperforming bonds. Monetary tightening has generally done the opposite.
Covid-19 and Ultra-Lax Monetary Policy
So what might have caused the average stock-bond correlation to go negative during the past 20 years?
Using Ilmanen’s framework, the longer-term downtrend in inflation, periodically flirting with deflation, seems the obvious answer. But monetary policy has played a role as well. A trend towards lower policy rates has accompanied the gradual moderation in inflation. Equally important is the fact that this has allowed the main central banks to go more aggressively countercyclical during economic downturns, boosting the return on government bonds.
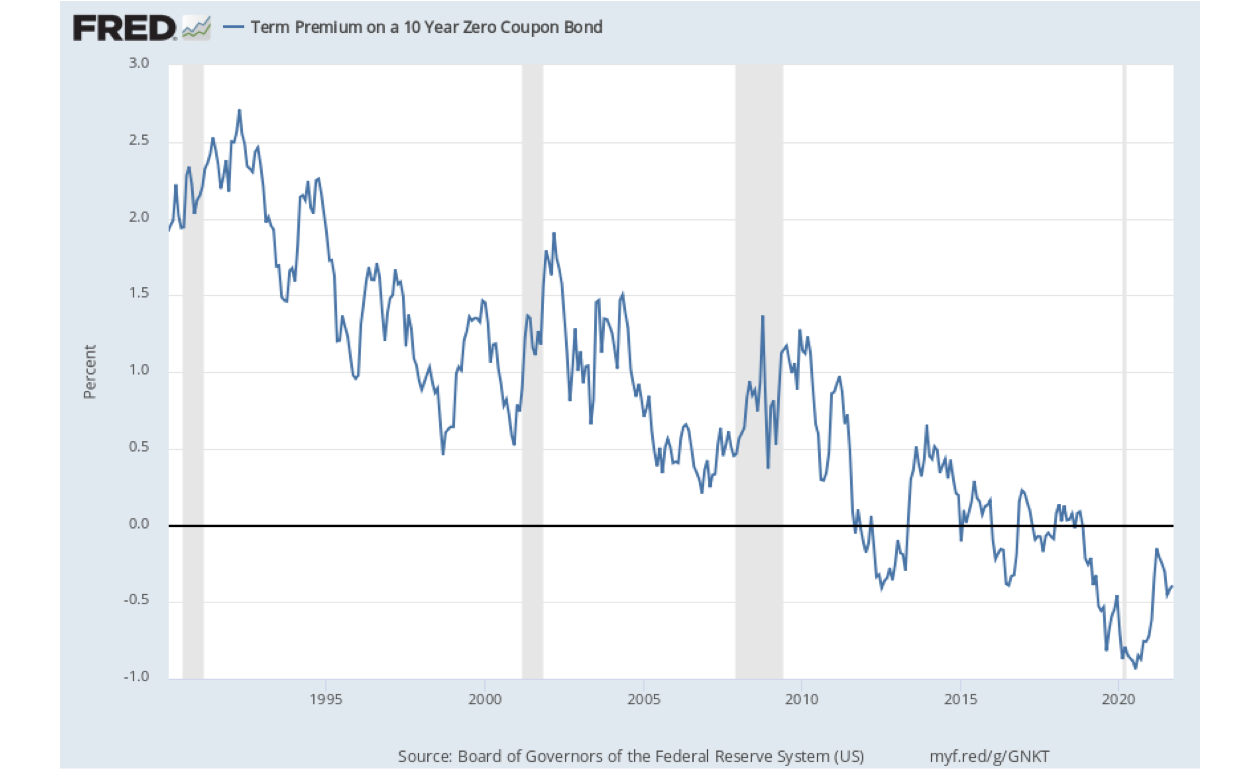
Expectations of policy rates being 'lower for longer' have helped reduce bond yields, reinforced by quantitative easing (QE). Central banks buying long-dated paper in the secondary market has combined with the demand for bonds as a hedging instrument to drive the term premium on long-dated bonds deeply into negative territory (see Figure 4).
Figure 4: The US Term Premium
Enter Covid-19. The Fed had only tentatively normalised monetary policy before the pandemic set in, and the ECB had done even less. This came at a price: ultra-lax monetary policy leading up to the crisis had left government bonds in expensive territory with limited ability to rally and provide a cushion for the collapsing stock market. In the end, risk assets were saved by a combination of an unprecedented fiscal stimulus and QE, which involved the purchase of corporate bonds by the Fed for the first time. As a result, monetary policy had become even more unconventional.
But Covid-19 subsequently presented a new challenge. International supply chains broke down, boosting input prices – and the ensuing labour market mismatch between supply and demand created upward pressure on wages and salaries.
This has left central banks in an unenviable position. Taper QE and raise rates too early or too much and risk putting the favourable recovery from Covid-19 in jeopardy. Wait too long and risk that the notion that current inflationary pressures are ‘transitory’ is proven wrong, creating a need for an even tighter monetary policy later.
Asset allocation and the Stock-Bond Correlation
The stock market is currently concerned over the apparent loss of growth momentum in the economy – visible in survey indicators, surprise indices and leading indicators.
The Delta and Mu Covid-19 variants have only compounded these concerns and valuations have added to the unease: stocks appear expensive on long-term metrics such as Shiller’s P/E, market-cap to GDP or Tobin’s Q.
But is a cyclical slowdown truly the greatest risk in the current scenario? On the positive side, a moderation in growth would likely make central banks tread even more carefully when normalising monetary policy, giving investors more time to gradually adjust portfolios.
Persistently high inflation, on the other hand, has no silver lining. In an environment of rising policy rates, multiple contractions are more likely, and arguably, government paper is no cheaper than stocks. The manifestation of this risk would be a positive and growing stock-bond correlation, with bonds not only losing their hedge capacity but instead becoming a key source of stock market weakness.
However, a rosier scenario should not be ruled out. Pent-up consumer demand is far from exhausted and growth above trend could continue well into the next phase of the cycle. Supply chains will eventually be rebuilt, and inflation could stabilise at some acceptable level. From the point of view of our tactical asset allocation, the timing of these factors is crucial. While we are waiting, the stock-bond correlation bears watching.
If you want to learn more about the stock-bond correlation, contact us today to get access to a specialist course on this topic. We work solely with world-class financial experts to bring you cutting-edge courses that can answer any questions you may have in regards to stocks or bonds.
Our team of expert teachers are ready and waiting!
Notes
- The yield-to-maturity on an n-period zero coupon bond, , can be expressed as the expected return from investing at a known 1-period rate, , and at a series of n-1 expected forward rates, , … plus a term premium. This can be written as follows:

The term premium represents a compensation for the risk of holding longer-dated paper instead of a series of short-term bonds. It is therefore expected to be positive under normal circumstances. Note that the term premium differs from the term spread, aka the slope of the yield curve.
References
Ang, Andrew, and J. Chen. 2002. “Asymmetric Correlations of Equity Portfolios”. Journal of Financial Economics, 63(3), 443-494.
Bae, K.H., G.A. Karolyi, and R. M. Stulz. 2003. “A New Approach to Measuring Financial Market Contagion.” Review of Financial Studies, 16, 717-64.
Chua, D.B., M. Kritzman, and S. Page. 2009. “The Myth of Diversification.” Journal of Portfolio Management 36(1): 26-35.
Ilmanen, Antti. 2003. “Stock-Bond Correlations.” Journal of Fixed Income 13(2): 55-66
Longin, F. and Solnik, B. 2001. “Extreme Correlation of International Equity Markets.” Journal of Finance, 56(2), 649-676.
Page, S., and R. A. Panariello. 2018. “When Diversification Fails.” Financial Analysts Journal 74 (3): 19–32.
Related Course
Tactical and Dynamic Asset Allocation